The problem of predicting the effects of the asymmetric far sidelobes of MAP has been addressed as follows. First, the predicted sidelobes have been calculated by Chris Barnes and Lyman Page. Результаты этих вычислений представлены следующим образом:
        Pixel      ER             EI             HR             HI
            0 -1.4374841E-02  3.0598873E-03 -1.0360376E-02  2.6487419E-03
            1  2.7956847E-02  8.2298471E-03  1.0758067E-02  3.8951519E-03
            2  1.1091543E-02  1.3199418E-02  3.4489476E-03  7.8688208E-03
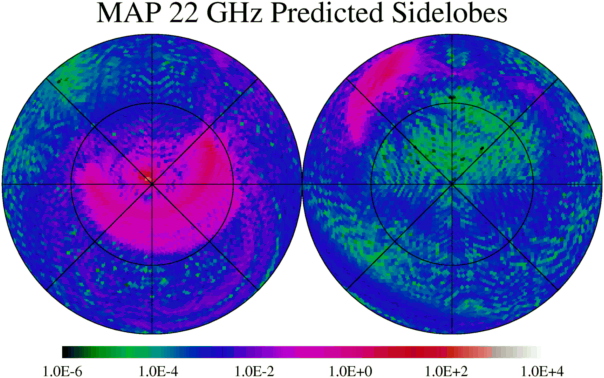 Я рассчитал (ER2 + EI2 + HR2 +
HI2) для каждого пикселя, что дало мне карту, приведенную справа.
I believe that these values are the response relative to an isotropic
beam. An isotropic beam would have a value 1 for each pixel, so the
sum of the values would add up to the number of pixels, which is 12,288
for these calculations. Однако действительная сумма составляет лишь 0.151 от этого,
поскольку the main beam is not sampled in the pixel grid.

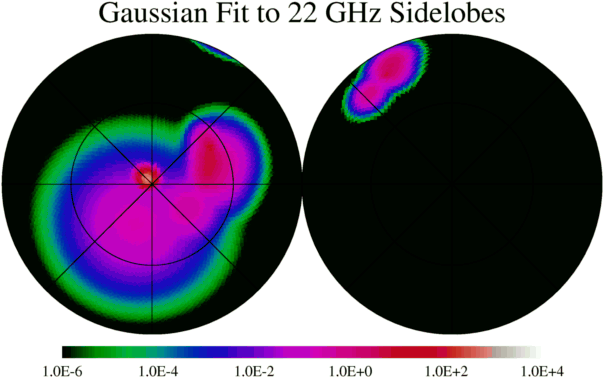
The predicted far sidelobes were represented by a sum of circular Gaussians. The widths of the Gaussians were chosen from a discrete set: интеграл Гауссиана, деленный на его максимальное значение должен равняться телесному углу of a HEALpix pixel при некотором разрешении. Здесь представлен результат в системе координат, используемых для предсказанных карт боковых лепестков. Для представления карты боковых лепестков использовалось 33 Гауссиана. Note that the sum of these terms only amounts to 0.124722 of a full isotropic beam, so most of the power is in the main beam which is not adequately sampled.
Положения, ширины, и максимумы Гауссианов были выбраны с использованием
простого рекурсивного алгоритма. Let GJ be the peak of the
galaxy map after it is smoothed with a Gaussian having width corresponding
to res=J. Then a threshold for res=J is given by
ThresholdJ = TOLERANCE*12*4J/GJ.
If all the pixels in a block corresponding to one pixel at res=J have
sidelobe values less than the threshold, then ignore that block.
If the values exceed the tolerance but the range from minimum to maximum
in the block is less than the tolerance, then represent the block of pixels
by one Gaussian at res=J. If neither of these conditions holds, then
subdivide the block into the four pixels at res=J+1 and try again.
It would be a good idea to then optimize the positions and amplitudes
of the resulting Gaussians to get a better representation of the sidelobe
map but I have not done that yet.
There is a trade off between the TOLERANCE and the amount of work needed
to simulate the time-ordered sidelobe signal. The 33 Gaussians were
obtained with a tolerance of 10 microK. This many Gaussians increases
the run-time for my simulator by a factor of 10, so the TOLERANCE should
not be set too low.
I have taken the 5 Gaussians closest to the main beam out of the sidelobe map, and replaced them by the main beam. This pattern was then rotated by 70.5o around the x-axis to bring the main beam to its position close to the +y axis in the spacecraft coordinate system. This gave me the plus beam and 28 sidelobe beams. I then duplicated this pattern by setting y to -y and negating the amplitude to get the negative beam and its sidelobes.
The sum of the contributions from the far sidelobe Gaussians that I included
in my simulation is only 0.0136 times a full isotropic response. Thus
these sidelobes should not create a huge signal. By excluding the 5 res=5
pixels closest to the main beam from the sidelobe signal, I have basically
excluded an area equivalent to a circle with radius = 2.3o.
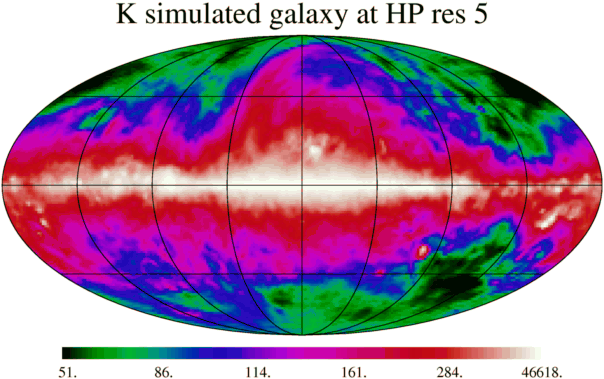 The simulated 22 GHz galaxy map was smoothed with each of
the Gaussian widths.
Here the integral of the Gaussian divided by its peak value is
equal to the solid angle of a HEALpix res=5 pixel (12288 pixels).
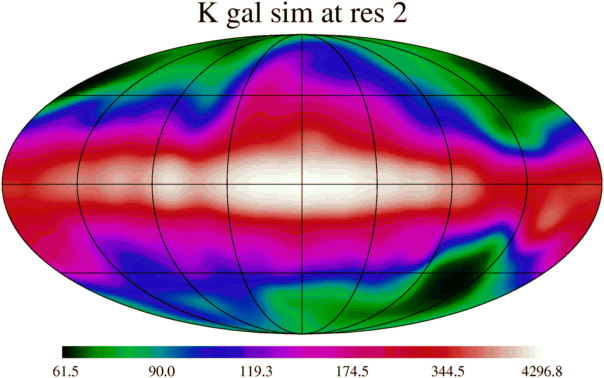 The map was also smoothed with wider Gaussians, corresponding to
lower resolutions, such as this map for HEALpix res=2 (192 pixels).
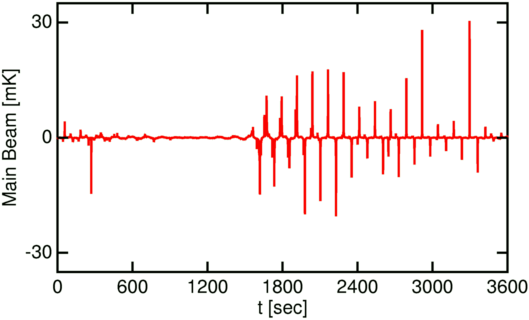
Time ordered data was then generated. For a period of 1 hour following a start time of 0000 UT on 2 Sep 2001, the main beam signal was generated using
Vmb(t) = M(I+(t);8) - M(I-(t);8)
where M(I,J) is the simulated sky smoothed to resolution J. I used a res=8 simulated galaxy map for the sky, smoothed from the res=9 simulated map I got from Gary Hinshaw. The figure below shows the main beam time ordered signal.
The far sidelobe signal was generated by summing over the Gaussians
used to represent the sidelobe map. The center of each Gaussian was
converted into a res=8 pixel number, which was then used to look up
the value of the map smoothed to res=J but tabulated at res=8.
This map value was then multiplied by a coefficient given by
A=[12*4J]-1*B
where B is sidelobe value
at the center of the Gaussian. The prefactor is the
fraction of the sky in one pixel at res=J. This prefactor scales the
values so that if the sidelobe map is a constant B=1, and the sky map
is a constant T=1, then the resulting sum over all the sidelobe Gaussians
will also be 1, which corresponds to the scaling of the sidelobe maps
to gain relative to an isotropic beam.
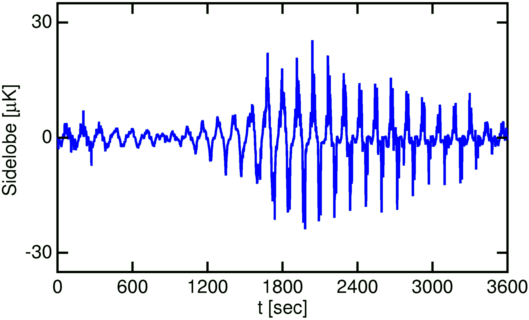
Thus the sidelobe signal is given by
Vsl(t) = SUMk Ak
M(Ik(t);Jk)
The figure below shows the sidelobe signal for the same time interval
as the main beam signal above, but with a scale in microK instead of milliK.
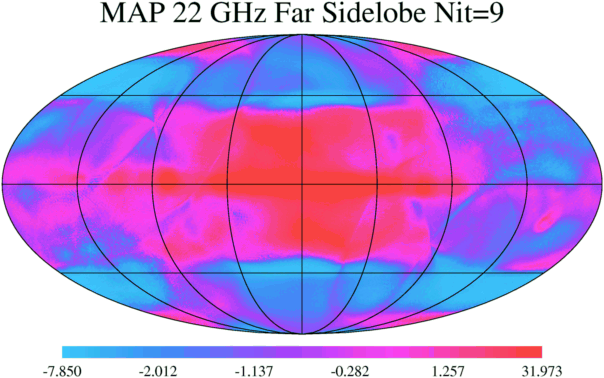 Feeding this time-ordered signal into the map-making algorithm will produce
a map which represents the error we will make by not correcting for the
far sidelobes. After 10 iterations of Wright, Hinshaw and Bennett using
a full year of data, the map on the right was obtained. This map is
histogram equalized, so 60 percent of the sky has errors less than
± 1.6 microK, which is probably acceptable for 22 GHz.
The symmetric beam should be subtracted from the sidelobe map before beginning this process. If we have a full resolution all sky map of the beam, it should be averaged in rings centered on the axis to get a symmetric beam, and then subtracted from the actual beam. The inner part of this residual should then be modeled using copies of the symmetrized beam. These inner asymmetric sidelobes can be included in the map-making algorithm if the very simple minded iteration scheme in Wright, Hinshaw and Bennett is replaced by more sophisticated technique such as the conjugate gradient method. Beyond a radius of a few degrees, the residual should be modeled with Gaussians as I have done here. The time-ordered signal produced by these far sidelobe Gaussians can be subtracted from the time-ordered data to give a corrected time stream which can be used to make corrected maps.