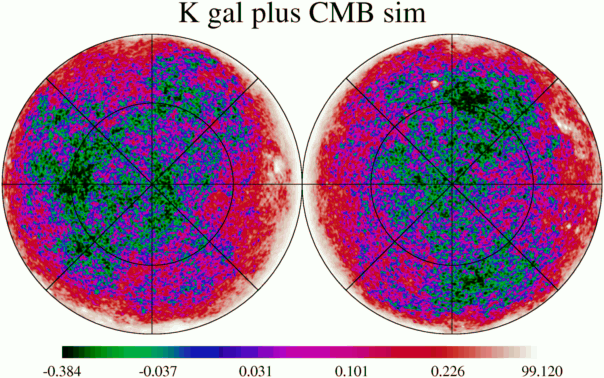
The main beam ellipticity has been represented using several copies of the symmetrized main beam. The first attempt using two half-weight copies did not give a good iteration result, so the results I am reporting here use a quad of low amplitudes copies in the following pattern:
              -0.085

     +0.085    1.0      +0.085

              -0.085
For sidebeams with amplitude ± &eps, spaced d &sigma away from the main beam,
the second moment in the wide direction is sigma^2*(1+2(d/sigma)^2*eps)
while in the narrow direction it is sigma^2*(1-2(d/sigma)^2*eps).
If the spacing is set at the HWHM of a Gaussian [d/sigma = 1.18]
these amplitudes produce
a 27% difference between the major and minor axes of the elliptical beam.
For the simulations reported here the spacing d=0.46o to match the
HWHM of the K band beam.
In these simulations the time-ordered data is generated by looking up
the appropriate pixels in a res=9 simulated map of the K band sky.
This is the "gpc" map that included both CMB fluctuations and the
simulated galaxy.

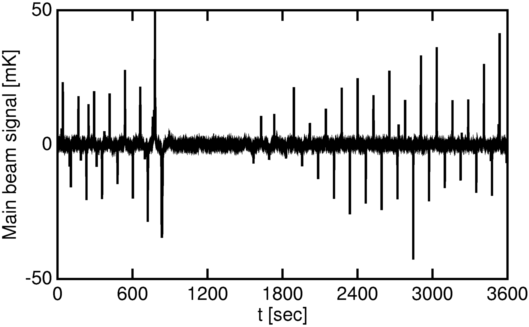
Two TOD streams were generated. One just had the main beams, while the second stream had the quad of sidelobe beams. The map generated from this second stream shows the error made by not allowing for the ellipticity of the main beam.
The graph below shows the simulated signal in the main beams:
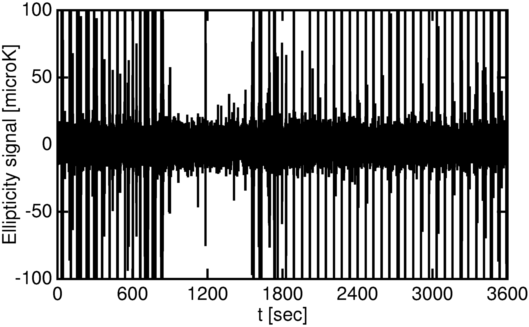
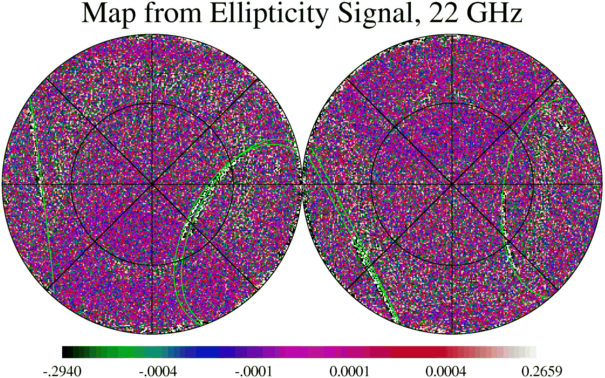
The map below shows the residuals after 30 iterations on the signal just
from the main beam. One sees the usual slowly converging ell=4 residual
plus the granular errors generated by high gradients.
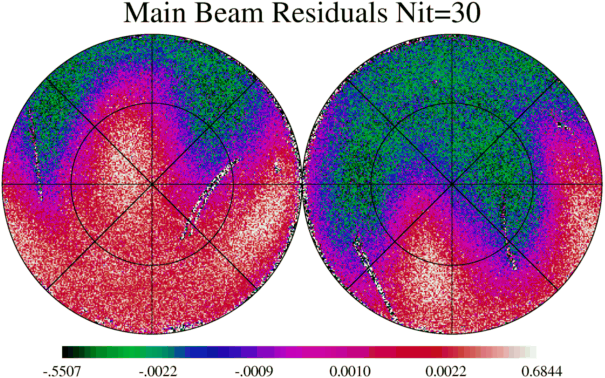
The iteration scheme should be modified to explicitly allow for these Gaussians. But in some sense this effort is unnecessary, because the magnitude of this effect is small enough to ignore.
The technique used here can easily be extended to handle the four-fold symmetric sidebeams introduced by the reflector distortion in the W-band beams. Eight sidebeams with alternating amplitudes would be used to model the deviation from a symmetric beam.